I’ve been playing a bit more with the 2016 and 2017 QHP data in an attempt to figure out the incremental cost of the Trump Executive order. I think 4.25% is a good lower estimate.
Data and Methods
I again excluded Kentucky and Louisiana. Kentucky was switching from Kynect to Healthcare.gov while Louisiana had a mid-year Medicaid expansion. I wanted to isolate the effect of the executive order from whatever the general trend in enrollment was. I used the CMS enrollment snapshot for 2016 and 2017 that contained January 14th. 2016 was goes through January 16 while 2017 only goes through January 14th. The 2016 report contains two extra days worth of data and more importantly, 2016 contains a deadline day as people who buy coverage by the 15th would see their policy start on February 1st. We know deadlines spur enrollment.
More than 8.8 million Americans were signed up for 2017 coverage through HealthCare.gov as of January 14, 2017. This compares to about 8.7 million sign-ups as of January 14 last year, as Americans continue to demonstrate strong demand for 2017 Marketplace coverage.
So on the 14th of each year, 2017 was running slightly ahead of 2016. My data due to timing constraints will show 2016 running slightly ahead of 2017. This is fine as the known flaw in the data favors the argument that the executive order had no impact.
So the question is what was the deviation from 1/15 to 1/31? If the Executive Order and the dropping of advertising and potentially elite knowledge networks disseminating anti-enrollment messaging or more likely fear, uncertainty and doubt about PPACA being a good play?
Analysis and Conclusion
2017 using my known flawed data was running .96% behind 2016 on the January 14th inclusive update. 2017 ended up running 5.25% behind 2016 on Healthcare.gov states. The increment (using favorable to the null hypothesis data) slowdown in pace that can be attributed to Trump Administration actions is 5.25-.96 or 4.29% of enrollment was lost due to the executive order and other Trump administration actions such as shutting down some outreach and advertising in the last eleven days of enrollment.
4.29% is a minimal level of enrollment loss. Using the January 14th pace, 2017 was running 1.1% ahead of 2016. Charles Gaba is collecting data from the state based exchanges. The state based exchanges ran their own marketing campaigns that did not get shut off on 1/20/17. He is showing at least a 1.5% enrollment increase. So more aggressive baselines can credibly argue that the Trump Administration actively discouraged 6% of the market from signing up.
Finally, here are some charts that I had fun creating as I worked through this problem.
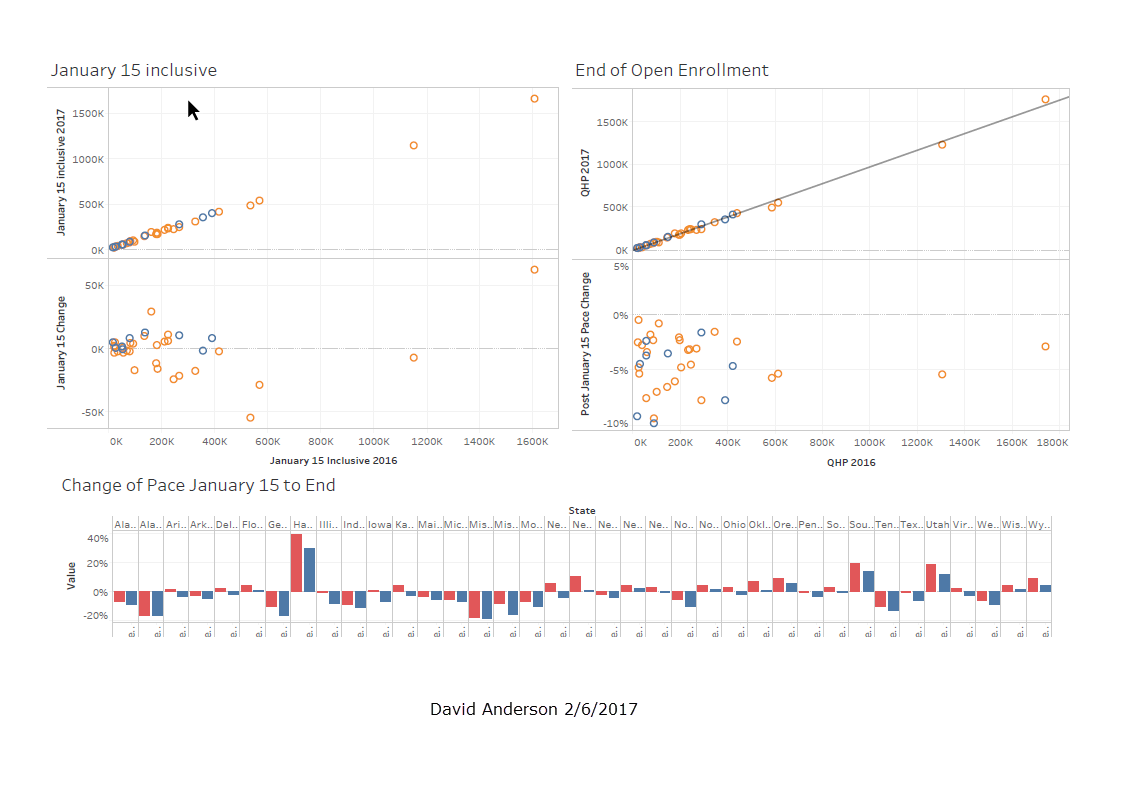
4.29% enrollment loss is the cost of Trump’s First Day EOPost + Comments (34)