This is a short cheat sheet of some of the data analysis questions I keep in the back of my head.
1) Lags
COVID has serious lags at all stages of the information flow.
- Multi-day lag from exposure to testing
- Zero to multi-day lag from testing to result
- Negative and positive lag from testing to symptoms
- Zero to multi-day lag from new infection to start of contact tracing and testing
- Week lag from symptoms starting and potential hospitalization
- Week lag from hospitalization to ICU
- Zero to long lag from ICU to death
- Multi-week lag from ICU to discharge
- Significant lags between death and reports of death
- Widely variable death certificate reporting practices
2) Differential impacts
- COVID hits older people far harder
- Non-linear effects
- Massive current racial, ethnic, and economic disparities as a reflection of historical patterns of discrimination and power.
3) Hospital system status
- Overwhelmed hospitals have far higher age adjusted case fatality rates than not overwhelmed hospitals
4) Learning
- We’ve learned a lot over the first four months of the US pandemic and hospital surge
- Dex, proning, remisdivir all seem to help and reduce mortality rates and hospital duration
- We don’t know what long term looks like as we are still in the short term
- We don’t know a lot including how differential factors influence infections and outcomes (esp. with kids)
We should expect a fairly young population to have a far less severe disease course with fewer hospitalizations and deaths than a fairly old population that is identical in all aspects other than age. We should expect fatality rates to be far lower in regions with significant available and reserve staffed hospital beds then regions that are getting slammed.
Talking Points Memo had a good image of Florida’s positivity rate and case count:
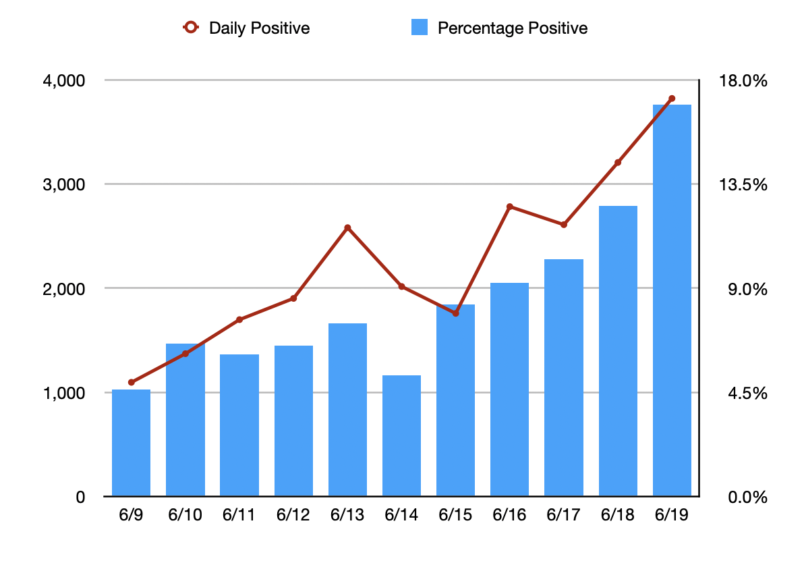
The cases on 6/19 are probably generating hospitalizations at the start of July. Anything done today won’t show up in death data until after the 4th of July.
These are just some thoughts on how to think through COVID data reporting.
Enhanced Voting Techniques
You forgot one of the biggest problems with the data “outright deliberate under counting”
gkoutnik
Any evidence yet that they ameliorate the longer-term damage to organs, etc.?
David Anderson
@gkoutnik: No evidence that I am aware of but I am not a clinician.
WereBear
There’s also no cure for the short-term strategy of Republicans apparently thinking the virus won’t notice they are messing with the numbers.
Cheryl Rofer
I would add, but I’m not sure in which category,
cmorenc
@Enhanced Voting Techniques:
If the rates that are being reported keep trending, the true situation in deliberate undercount places like Fla. will become as hard to hide as an elephant under a mattress.
@Enhanced Voting Techniques:
Betty
A big concern is that there seems to be too little attention being paid to long-term effects on survivors. The virus can ravage bodies. The cost could be enormous in medical bills and lost productivity.
David C
@gkoutnik: It’s early – long-term will be 6 months to a year down the road. My colleagues and I are working on a manuscript comparing Covid with radiation syndromes – there are some similarities in their multi-organ nature, including vascular damage and inflammation.
Matt McIrvin
I am already seeing conservatives switching from touting the lack of a rise in new cases in Florida, to pointing out that the death rate isn’t increasing. They can probably keep that up for a couple of weeks.
UncleEbeneezer
I only barely passed Stats-101, so maybe others here can help: what’s the best response when Conservatives play the Cases Are Only Rising Because of More Testing card?
Roger Moore
@Matt McIrvin:
The head in the sand attitude is the really dangerous part. Basing your actions on a lagging indicator in a fast-moving situation is asking for disaster.
Dev Null
under 2. you left out racial disparities.
I believe that there are also income / wealth disparities – how could there not be? – but I can’t remember seeing a (quantitative) reference
Useful list, thanks.
David Anderson
@David C: If you can share a draft of that manuscript I would love to read it — e-mail me via Balloon Juice or Duke.
Roger Moore
@UncleEbeneezer:
The correct response is to look at the percent of positive tests. Since that’s independent of or even inversely related to the number of tests, an increasing positive test rate is a bad sign. This is also something even people who aren’t good with numbers should understand. If the number of actual cases is steady and you increase the number of tests, you’d expect the percent of positives to stay stable or even go down. If you increase the number of tests and the percent of tests coming back increases, it’s because the disease is growing out of control.
UncleEbeneezer
@Roger Moore: Thank you. That’s perfect.
David Anderson
@UncleEbeneezer: Positivity rate — if cases are only rising because testing is rising, we should see the positivity rate stay flat or more likely decline.
If we assume that we have a stable spread and assume that people are not being randomly tested (people who feel ill or suspect that they were exposed are more likely to be tested than people who feel great and have been in strict isolation for a month), then an additional 100 tests in the general population should only pick up either the baseline infectious rate OR more likely pick up a little bit below the baseline rate.
If there is uncontrolled spread that is increasing faster than testing, than the positivity rate will increase as more people are feeling like shit or have reason to expect that they were exposed.
Dev Null
Dunno if these points are relevant to your analysis, but:
Dev Null
@Cheryl Rofer: An interesting-to-me point I’ve seen mentioned in news reports recently, that COVID-19 particularly in the South is being transmitted preferentially by the 20-40 year-old cohort.
There is a report of a group of 13 or 16 young women (nurses? I don’t remember) in Florida who went bar-hopping one night after DeSantis opened up the state. They all came down with COVID-19. Every one, if the reports are to be believed.
Other venues mentioned are frat parties.
Dunno whether it’s relevant to DA’s purposes, but it is striking (even if unsurprising) that outcome statistics can beare shaped by transmission statistics just as much as by inherent susceptibility.
And COVID-19 outcome statistics are tangentially relevant to the outcome of the November elections. E2A: point being, transmission statistics are relevant to the November elections via outcome statistics.
E2A: another transmission-relevant point is that evidence seems to be pointing to transmission primarily
by super-spreadersvia super-spreading events.Roger Moore
@Dev Null:
This is exactly why we should be focusing on shutting that kind of thing down. I remember reading that super spreading events make up something like 80% of transmissions. Since R0 is about 3, eliminating 80% of transmissions should get R to well below 1, which would be enough to crush the epidemic. IOW, completely stopping superspreading events should be enough by itself.
David Anderson
@Dev Null: Every point you make is a good one. These are my quick and dirty thoughts on how to think about COVID before I read anything that is tied to COVID. Your point on racial disparities is vital.
UncleEbeneezer
@David Anderson: Is there any place with curve-charts by State for tracking this?
Dev Null
Speaking of treatments aimed at mitigating the severity of the infections (looking at remdesivir): famotidine / Pepcid is in trial.
https://blogs.sciencemag.org/pipeline/archives/2020/05/29/famotidine-histamine-and-the-coronavirus
An early report (6/10):
https://gut.bmj.com/content/early/2020/06/10/gutjnl-2020-321852.full
and a research preprint posted today:
https://www.researchsquare.com/article/rs-30934/v2
2nd&3rd links from the sciencemag post.
YMMV.
Perhaps the following report has already been mentioned by AL or by other commenters, but it made me furious, so I’ll add the link with the excuse that the report is relevant to differential outcomes (it also mentions funding of trials of other repurposed drugs):
https://www.nytimes.com/2020/06/19/health/coronavirus-lung-treatment-funding.html
“Resources are finite” is an all-purpose all-the-time excuse; if there’s a mention of the size of $ repurposed away from lung treatments, I missed it.
When vaccine development outcome is uncertain, when vaccines are unlikely to be widely available until well into 2021 (if then) , when immunity duration is uncertain, and when lung damage is a common result of infection … seems like putting a few chips on development of lung treatments would make sense.
Another Scott
A good summary; thanks.
Something that’s in the forefront of our mind – we still know far too little about this disease. (Maybe it’s out there and I haven’t seen it, but) The conventional wisdom is that “80% have no or mild symptoms, 20% have serious symptoms including 5% that need hospitalization/ICU, 1% will die”. But those numbers seem to be based on very early experience in Wuhan. And the list of “symptoms” seems to expand by the week. How is this consistent? What is happening in the 80% in the USA now?
Of those who have “no or mild symptoms”, how many have to miss work beyond the sensible mandatory 14 day isolation period? How many have weeks or months of fatigue afterwards? (e.g. TaMara’s experience.) What will happen to those in the 80% who have been laid off, lost their health insurance, etc., on August 1 (when the first rescue bill runs out)?
tl;dr – I’m worried that too many people still think that if they don’t get hospitalized by COVID-19 then it’s no big deal. :-(
Thanks.
Cheers,
Scott.
Brachiator
@David Anderson:
Every point you make is a good one. These are my quick and dirty thoughts on how to think about COVID before I read anything that is tied to COVID. Your point on racial disparities is vital.
Coming late to the thread.
BBC News reported on an 89 page report done by Public Health England on “Disparaties in Risk and Outcomes” related to the virus. Some of the information and methodology is relevant to what we need to find out here as well.
The report looks at economic disparities, ethnicity, gender and other factors.
Other reports looked at the impact of the disease in London vs Northern England, which is roughly similar to looking at urban vs rural or blue state vs red state.
UncleEbeneezer
@UncleEbeneezer: Never mind I found it here (just pick your state): https://coronavirus.jhu.edu/testing/individual-states/alabama
Dev Null
Yep. There’s a recent Bloomberg article that makes this point:
Super-spreaders could make COVID-19 easier to control
(No idea how I came across the article; if AL has already posted this, that might be my source, in which case my apologies to AL.)
Dev Null
Thanks… your list is a useful “cheat sheet” to have at hand while reading.
I dunno whether the Navajos should be in a category of their own, but a priori it seems surprising to me that they have been hit so hard.
ie is their experience explicable on the grounds you’ve mentioned, or is some other factor involved?
Dev Null
Hunh, interesting, sounds like a useful link.
I was about to suggest to DA that a comprehensive summary article developed from his outline would be a useful reference for laypeeps like me. (Thinking along the lines of RevModPhys for a physics summary article or IEEE Proceedings for an engineering summary.)
Brachiator
@Dev Null:
One of the many things that stood out was the difference in risk by gender. Men, and not just older men, are much more at risk.
Also, the risks related to ethnicity is very complex and obviously varies with respect to the differing communities in various countries. However, the study suggests some things that can be looked at that are similar to many groups. Diabetes, for example, as a underlying medical factor. Or the tendency of some groups to have multiple generations living in a household, as an underlying social factor.
Cathie from Canada
“What did he REALLY die of?” is the question I am seeing now on twitter posts about someone’s relative who died of COVID.
It’s pathetic, and disturbing. I think the pandemic is now being SandyHooked among Trump’s faithful, and too many pro-Trumpers are trying to maintain their questionable sanity by claiming the virus really isn’t widespread or deadly or even existing still.
Mike G
There was a recent study that Type A blood is 50% more susceptible to COVID and Type O 50% less.
Dev Null
@UncleEbeneezer: Lots and lots of trackers & visualization tools out there.
I like worldometer’s tables:
https://www.worldometers.info/coronavirus/country/us/
You can sort on any column by clicking on the column label. You can go back one day (two days for world/nation data).
I think you can download tables, but I haven’t tried.
For visualizations I recently ran across:
https://91-divoc.com/pages/covid-visualization/
Our World in Data is also good:
https://ourworldindata.org/coronavirus
but the last time I looked I couldn’t find state data in the time I was willing to spend looking.
Charles Gaba has spreadsheets, and Reichlab has projections. Children’s Hospital (Philly) too.
The New York Times interactive pages (e.g. here) are sometimes useful…
Google has mobility data online here.
Lots of other tools online, as said. Each tool has its sweet spot.
Dev Null
Yep, more generally co-morbidities might be another factor in DA’s cheat sheet.
Diabetes, obesity, and hypertension, among others
Dev Null
The data leave no doubt that mortality rates increase with increasing age, but …
… an obvious question: in view of the facts that 1) nursing homes account for roughly half of all deaths worldwide, and 2) nursing homes are exceptionally conducive to the spread of COVID-19 …
… has the correlation between transmissibility in nursing homes and elevated mortality rates for the oldest cohort been teased apart?
Dev Null
@Another Scott: It seems a bit early for the thread to be dead, but since no-one has responded, I thought I’d take a layman whack at your questions:
I saw three (I think) Hoover Institution white papers April or early May that confidently posited that “we know enough about COVID-19 to know that it’s time to shift to a policy of herd immunity”. IIRC two of them cited Sweden as a success story. (Narrator: “Sweden is not a success story.”)
The medical guys I read agree with you, not with the economists at Hoover, FWIW. Here’s a recent post by Eric Topol on “what we’ve been missing”.
Mmmm, I don’t think this is correct. Iceland reported ~50% asymptomatic. Diamond Princess had 30% asymptomatic. The initial report by the WHO (based on Wuhan’s experience) that claimed very low asymptomatic rates (15%? I don’t remember) seems to have been wrong AFAICT. I don’t think the asymptomatic rate has been nailed down yet.
Mortality rates are hard when you have a large number of asymptomatic individuals, needless to say. Or when you don’t test people, which is why random testing in NYC post-Surge was such a big deal. Or when you classify deaths as caused by an ILI (“influenza-like illness”), er, like Florida, which is why excess mortality rates are interesting. Or when hospitals are overloaded and triage patients.
There’s some evidence (IIRC, from hospitalization / death rates in Germany / Italy / Spain / France) that environmental factors affect mortality rates, but I don’t know how strong the evidence is (and I might be misremembering the claim – I don’t have a link.)
Recent (mostly anecdotal AFAIK) evidence in the medical lay lit I’ve read says that COVID-19 attacks the epithelial layer (I had to look up “epithelial”, which should tell you how little I know) and is spread via the epithelial layer to all parts of the body, even to the brain in some cases. Also too clotting.
Cytokine storms confound the assignment of symptoms to cause, because some symptoms are the result of an out-of-control immune system rather than damage caused by COVID-19.
I haven’t seen numbers. STAT and Science and the Washington Post have all posted recently on point cases. Some people have speculated that COVID-19 can trigger chronic fatigue syndrome.
There’ve been reports of people receiving $1M+ hospital bills. If there’s no new stimulus / support / rescue bill, then this is one forecast. “Prediction is hard, especially the future.”
Hoping you will find this to be of some use.
UncleEbeneezer
@Dev Null: Yeah I’ve been using Worldometer since the beginning. The other thing I’d like to see is something showing State (or county) hospital capacity, since that seems like such a crucial measuring stick. Any good links for that? I saw some good Twitter threads on the subject but don’t remember any regularly updated resources.
Brachiator
@Dev Null:
To some degree it has been. I refer you to the BBC program “More or Less,” and the episodes dealing with the pandemic. Some observers had suggested that elderly CoronaVirus victims were going to die anyway, so their deaths should not be counted. But while it is true that people over age 80 generally have weaker immune systems than younger people, their average life expectancy is still a few years, not a few months.
Also, in advanced countries, very elderly people tend to be put in nursing homes. It’s just where they live. However, details are lacking about people who may have died alone at home.
I also wonder about possible differences related to wealth and mortality involving the elderly. Do rich old people have better outcomes?
Oh well. I hope these issues get raised again if this thread is totally dead.
piratedan
I’ve made this statement on the blog here before and I’ll make it again…
we’re all working with numbers from different sources and each “provider” of numbers is being tasked with providing different criteria dependent upon the agency asking…
in our shop, what the state entity is asking for is different than what the county is asking for and may yet be different than what the Feds are asking for, as each federal entity may be tracking different data points..
they’re still shaking out the protocols on what the standardized testing should be and there are still at least three reporting vectors in play, the point-of-care testing, the PCR testing and the serum testing. All use different instrumentation and all have variations on what is being reported and have differences in accuracy.
Each entity that is being reported to, is constantly moving their goal posts to know what they are looking for. Some want to account for total number of tests administered but don’t bother to separate out methodology, others are only tracking positives, others use both positives and inconclusive results. Unsure if anyone is tracking the amount of times an individual may be getting tested.
what I am trying to say is that the numbers that were in use back in February and March may have little resemblance to the numbers seen today as the number of tests administered, the agencies gathering their numbers and what is actually being measured, have all undergone some modification.
in short, its complicated.
Dev Null
Hmm, I believe I’ve seen sites that claim to have hospitalization data, but I haven’t been looking at hospitalization data. I’ll have to check my bookmarks.
But I read yesterday (ahem, somewhere) that not all states report hospitalization data, so there’s that.
Will check my bookmarks and let you know if I find anything. Or perhaps someone else has a link.
otmar
FWIW: The antibody test results are in for the rest of my family:
Father and son are positive.
Mother and daughter are negative.
Go figure.
Brachiator
@otmar:
May be consistent with theories that women exhibit stronger resistance to the virus.
Dev Null
@Brachiator:
This should have occurred to me… you don’t have to tease apart oldest cohort mortality and nursing home mortality, because many countries don’t have ALF / nursing homes. (That said, you might have to tease apart cultural factors and oldest cohort mortality in countries without ALF / nursing homes.)
Well, pace Masque of the Red Death, the sufficiently well-off can sequester themselves away from the hoi polloi to avoid being exposed, so I don’t think the answer is in doubt.
Similarly, if you pose the question as “do poor old people have worse outcomes”, the communal outbreaks in areas with meat-packing plants suggests that the answer is “you bet!”, partly because the Poors (even Old Poors) work unsafe jobs because they need the income, and partly because the Poors (in regions with meat-packing plants, anyway) tend to live in multi-generational housing.
Singapore’s migrant worker communities seem to have socialized COVID-19 infections in much the same way as communities associated with America’s meat-packing plants.
Perhaps there’s a way of asking the question that factors out social / community complications, but maybe not, since “rich / poor” is (AFAIK, anyway) primarily a social / community construct.
Another way of looking at this is the “essential workers” cohort, who are certainly not all poor, but many essential workers are poor (they’re not teleworking!) and have no choice about exposing themselves to infection. I seem to remember that many of the early deaths in the NYC metro region were greeters (e.g. Walmart, Trader Joe’s) and grocery store workers.
My two pesos, for what they’re worth.
Dev Null
@otmar: ugh. :-(
Best of wishes to you and yours.
Brachiator
@Dev Null:
But some migrant communities are like a naval vessel. The migrants may be younger, sometimes mainly male, and separated from their families and homes. You may see more infections, but less illness and hospitalization.
In any event, you have to be careful to categorize the different types of migrant communities. Foreign workers in one country. Domestic migrants who may come from one province to work in another, as in parts of India.
Also, earlier I wondered about the elderly rich. Being over 80 puts you more at risk no matter how much money you have. But the elderly very rich might be able to stay home or be in care facilities where records about their illness are kept confidential. So data and comparisons might be tougher.
Bobby Thomson
What is Dex?
Dev Null
Agreed. Really difficult to compare across cultures because there are so many confounding variables.
All I really meant wrt Singapore migrant communities was that the workers are tightly packed together, and in those tightly packed spaces COVID-19 spread like wildfire.
Doesn’t read directly on poor Olds, but it does say that spread in tightly packed communities (such as meat-packing worker residential housing) is highly likely.
This begs a slightly different question that seems to me more interesting than “do the rich Olds have better outcomes than poor Olds?”, to wit: do infected rich Olds have better outcomes than infected poor Olds?
More interesting because it’s a better defined question, I mean, and with care about definitions the answers might be invariant across cultures.
I haven’t seen data that would answer the question.
I wonder if data from the Theodore Roosevelt would be relevant. That’s not talking “rich”, but I’m guessing that infected sailors received top drawer care.
Dev Null
Backgrounder with links.
Dev Null
And that’s without intentional obfuscation as was the case with Georgia and Florida and maybe Texas as well. (not per se about testing, but still …)
There was a big fuss when CDC commingled PCR and serum tests on its web site. I mean, after the CDC finally got around to reporting test results on its website.
Bobby Thomson
@Dev Null: Thank you! The possibilities were seemingly endless.
Dev Null
@Bobby Thomson: We aim to please. :-)
If you’re interested, Laurie Garrett posted about a dozen links to steroid treatments on her twitter feed when the Oxford results were announced. IIRC she noted that steroids were repurposed to treat patients during the original SARS outbreak.
Look at her posts 14-16 June, they’ll be easy to find.
prostratedragon
Someone mentioned downloading data. I use the Johns Hopkins github site, where the data for their daily dashboard is stored. They have daily and time series reports on cases and deaths in files for the US by county (except for NYC whose 5 counties are bundled unfortunately) and the world. The updates seem to come during the wee hours. Files can be downloaded individually, or else the git-savvy know what to do.
The NYT also maintains a github site with their data. They also have countries and US counties in time series spreadsheets (csv), and since I last checked I see that they’ve added excess deaths for those countries and cities or regions that report it.
otmar
@Dev Null: antibody tests. Meaning everything is in the past. We’re all good, and actually we hoped for all 4 positive.
Dev Null
@otmar: ah. haven’t been reading comments lately, so I missed your earlier posts.
glad to hear it’s in the past.
Dev Null
In re older vs. younger cohorts:
https://twitter.com/ScottGottliebMD/status/1275074495464607751
Discussion downthread about the numbers being driven by testing criteria, so perhaps my earlier post about infections shifting to younger cohorts was wrong.
In re hospitalization rates, CDC has limited information here:
https://gis.cdc.gov/grasp/COVIDNet/COVID19_3.html
An online search turns up a bunch of state resources.
Dev Null
https://covidtracking.com/data
I haven’t looked at their formatted data so don’t know how easily it’s repurposed, but they seem to be as serious about hospitalization data as anyone. More serious than most.
Dev Null
@Dev Null: younger vs. older cohorts
I’ve seen more than half-a-dozen links arguing (or assuming) that those infected are trending younger, especially in southern states, e.g.
https://www.texastribune.org/2020/06/16/texas-coronavirus-spike-young-adults/
another:
https://twitter.com/taisonbell/status/1275139261566722049
(scroll down to Zöe McLaren’s response which takes as its starting point that most new cases in FL are in the 20-40 year old cohort)
and:
https://www.thedailybeast.com/coronavirus-surge-in-young-people-may-sabotage-reopening
Quantity of claims isn’t as good as quality of claim, needless to say.
I haven’t thought about the testing argument so am not sure whether more Youngs are getting COVID-19 or if testing is misleading (in re weighting by age) or whether both are factors.
The argument that (relatively speaking) Olds are avoiding exposure while Youngs are not seems plausible to me.